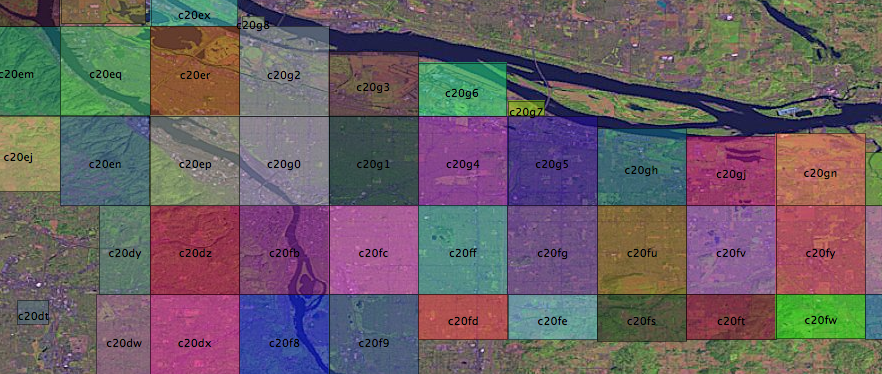
Overview
After analyzing the data, it would appear that we can use the geohash algorithm to geographically locate things in the Portland area by a short combination of letters and numbers. Because we only care about locations in and around Portland, we can throw away the majority of the geohash. What is left of this string can be used to geotag locations and should fulfill that requirement of the #pdxtags civicapps challenge idea. It would appear that we can identify areas in Portland as small as individual houses with just 5 characters, like 06ytd or 03qrf.
The interesting thing about this approach is that it eliminates the need for PostGIS or other spatial database when building applications with the civicapps data. Using a pdxhash to store locations would allow a programmer to do fast geographic lookups and basic spatial queries in Portland area, without a geodatabase or GIS software. It would also allow the use of non traditional application servers like the Google App Engine or NOSQL databases like Mongo or CouchDB.
Massaging the Data
Now that we have the Portland metro area address points loaded into a postgis table, we can begin working with the data. We will be doing gis operations at the SQL level. People commonly use ArcGIS Desktop to do analysis and data management tasks like these, but the open source tools work just as well. There are more GUI based open source methods to do what we are doing, but if you are interested in automating tasks and scripting, the command line rules.
The table schema in postgis matches the csv file which we loaded with ogr2ogr. The import added a column named wkb_geometry that contains the point in postgis' binary representation of a coordinate. The table contains 316,133 records that look a little like this:
select wkb_geometry, street_name, zip_code from address_data limit 10;
wkb_geometry                    | street_name | zip_code
0101000020E6100000D1C25823EAC262C045CEAEC8C8C04340 | LAMBERT     |
0101000020E6100000D1C25823EAC262C045CEAEC8C8C04340 | ASHBY       | 97229
0101000020E6100000D1C25823EAC262C045CEAEC8C8C04340 | 2ND         | 97080
0101000020E6100000D1C25823EAC262C045CEAEC8C8C04340 | CERVANTES   | 97035
0101000020E6100000D1C25823EAC262C045CEAEC8C8C04340 | 40TH        | 97123
0101000020E6100000D1C25823EAC262C045CEAEC8C8C04340 | PARK        | 97201
0101000020E6100000D1C25823EAC262C045CEAEC8C8C04340 | DOLPH       | 97219
0101000020E6100000D1C25823EAC262C045CEAEC8C8C04340 | 15TH        | 97030
0101000020E6100000D1C25823EAC262C045CEAEC8C8C04340 | 48TH        | 97213
0101000020E6100000D1C25823EAC262C045CEAEC8C8C04340 | 182ND       | 97233
(10 rows)
Putting the Data on a Map
If we fire up qgis and add this postgis layer, we can view all of the points on a map. We can symbolize the points based on the attributes in the table. For example we could make points have different colors based on their county. I'd like to visually differentiate the points based on their #pdxhash, which is a masked version of a geohash. Unfortunately the querybuilder in qgis doesn't allow you to get too fancy with sql functions, so we have to create a view.
A view is a little like a layer definition in ArcGIS. It allows us to create a virtual table that hides our more complicated queries behind what looks like a simple table. In our psql or pgadmin window, we can define the following view.
create view pdx_hash_address_view as
select substring(trim(ST_Geohash(wkb_geometry)) from 0 for 5) as pdx_hash_4,                                         substring(trim(ST_Geohash(wkb_geometry)) from 0 for 6) as pdx_hash_5,                                       substring(trim(ST_Geohash(wkb_geometry)) from 0 for 7) as pdx_hash_6,                                       substring(trim(ST_Geohash(wkb_geometry)) from 0 for 8) as pdx_hash_7,                                       wkb_geometry, ogc_fid
from address_data;
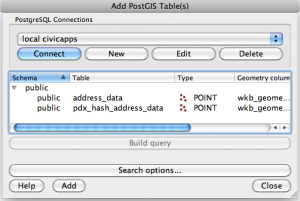
We need the wkb_geometry and ogc_fid data to provide our actually features and a primary key to keep things sorted out. Now we can go to postgis and pull up this layer just like we did with our original table. However it becomes obvious that the view is much slower than our original table. When we select our view we are doing multiple complicated operations on each row in our table. Fortunately postgresql offers us a way to easily "materialize" this view into it's own table.
select * into pdx_hash_address_data_table
from pdx_hash_address_view;
create INDEX pdx_hash__address_data_table_geom_idx on pdx_hash_address_data_table using gist (wkb_geometry);
Creating New Layers
When we use SELECT INTO, our new table is created automatically from the schema of our old table or view. Now instead of complicated function calls, our pdx_hash columns are simple text fields and our query is much faster. We also need to add a spatial index to this new table, so our operations on the points are speedy as well.
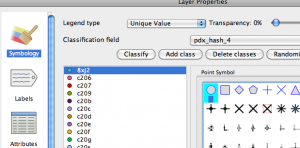
Now when we bring this layer into qgis, we can see the pdxhash attributes we have added and it is fast enough. We can symbolize the layer based on the pdx_hash_4 field. Immediately we can see that the main part of Portland is really represented by four of the pdx_hash_4 classes.

If we symbolize the data based on 108 pdx_hash_5 classes, we get a more interesting picture. Unfortunately when dealing with all of these points, it gets a little jumbled. However the map seems to validate using a 5 character pdxhash to break down the Portland area.
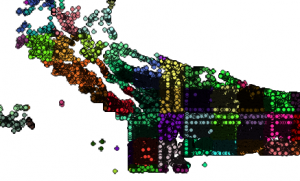
It would be nice if we could convert our points into polygons that represent each pdx_hash zone. It would make our map a little more visually effective. Right now it is hard to see the forest for the trees.
Common Table Expressions and Spatial Aggregates
One problem with working with a large dataset is that some operation can take a long time, especially when you make mistakes. In order to convert our point fields into polygons, we have to use postgis aggregate functions which behave like standard sql aggregates like max, sum, average only for geographic features.
It would be nice to work on just a subset of our data while we get our statement correct. We could create a new table with a limited subset of the address data records, but more recent sql implementations support something called a common table expression which will do that for us.
Creating Polygons and exporting Shapefiles
Using the WITH statement, we create a virtual table with only 10,000 records on which to perform our query. This is much faster for some operations than working on our entire dataset. When the query is solid, you just remove the "LIMIT 10000" from the common table expression and you are ready to go. As it turns out postgis can generate polygons from our point fields very quickly when the query is correct.
with pdx_hash as (select * from pdx_hash_address_data_table limit 10000)
select pdx_hash_5, ST_Envelope(ST_Collect(wkb_geometry)) as geom, count(*)                                                                               into pdx_hash_polygons from pdx_hash group by pdx_hash_5;
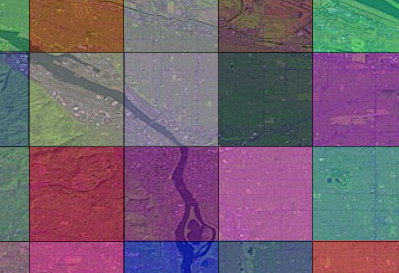
This query takes all the points which have the same pdx_hash_5 field and returns them on a single row using ST_Collect. The ST_Envelope function creates a polygon from the edge of the field of points. As you can see our, polygons enclose the regions defined by the pdxhash points in our previous queries. It also would appear that all these blocks begin with a pdx_hash of c2, which means that we can uniquely identify each zone with just three characters.
I've made some shapefiles for you to play with. The highest precision shapefile reveals the limitations of basing the polygons off of the address data. However, I don't beleive it invalidates the concept. I created the shapefiles using ogr2ogr. I did this example on a mac with postgis/postgresql, but you could execute basically the same queries with Microsoft SQL Server 2008.
ogr2ogr -skipfailures -nlt POLYGON -f "ESRI Shapefile" pdx_hash_polygon PG:"host=localhost dbname=civicapps" pdx_hash_polygon
pdx_hash_polygon.zip
 .
.

 We need the wkb_geometry and ogc_fid data to provide our actually features and a primary key to keep things sorted out. Now we can go to postgis and pull up this layer just like we did with our original table. However it becomes obvious that the view is much slower than our original table. When we select our view we are doing multiple complicated operations on each row in our table. Fortunately postgresql offers us a way to easily "materialize" this view into it's own table.
 Now when we bring this layer into qgis, we can see the pdxhash attributes we have added and it is fast enough. We can symbolize the layer based on the pdx_hash_4 field. Immediately we can see that the main part of Portland is really represented by four of the pdx_hash_4 classes.
  If we symbolize the data based on 108 pdx_hash_5 classes, we get a more interesting picture. Unfortunately when dealing with all of these points, it gets a little jumbled. However the map seems to validate using a 5 character pdxhash to break down the Portland area.
 It would be nice if we could convert our points into polygons that represent each pdx_hash zone. It would make our map a little more visually effective. Right now it is hard to see the forest for the trees.
